New Relic
Observability made simple.
New Relic One helps engineers create more perfect software. Instrument, analyze, troubleshoot, and optimize your entire software stack.
Next-Gen AIOps is Here.
Now it’s easier than ever to detect changes instantly, cut alert noise, and see probable root cause across any data source, without guesswork, lengthy setup, or a credit card.
New Relic One The Observability Platform
Collect all your telemetry data in one place to deliver full-stack observability and power AI-driven insights so you can confidently improve service reliability and accelerate time to market.

Build better software.
Move beyond traditional monitoring and embrace observability. New Relic One is designed for everything that makes modern software great, with a connected, real-time view of all your operational data in one place. So you can respond faster, optimize better, and build more perfect software.
New Relic One includes:
Telemetry Data Platform
The single source of truth for all your operational data
✓ 300+ agents and integrations, including OpenTelemetry, so you can ingest and store all of your operational data, including logs, in one place
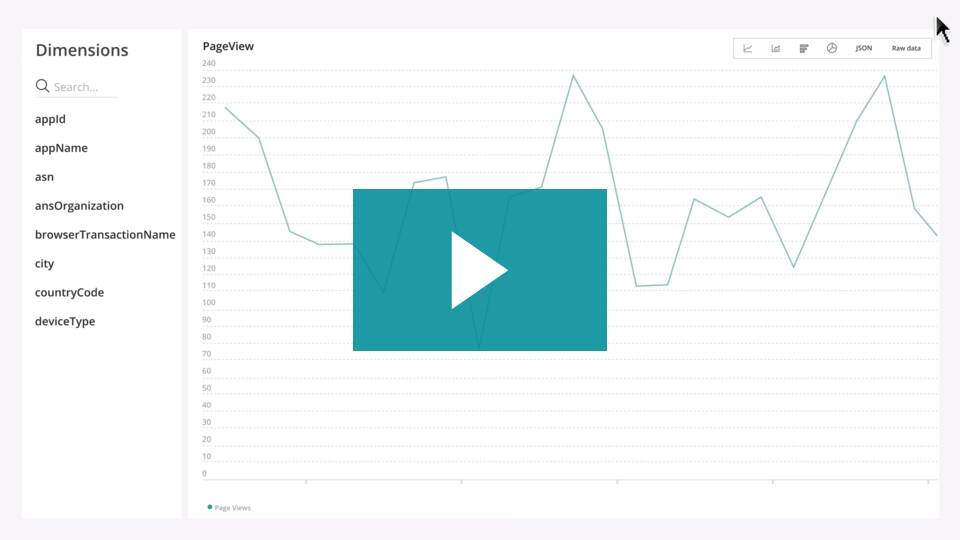
✓ Query with lightning-fast response times
✓ New Relic One + Grafana Dashboards
✓ Real-time alerts
✓ Build custom apps on first class product APIs and components with built-in hosting

Full-Stack Observability
Visualize, analyze, and optimize your entire software stack from One place
✓ Monitor your distributed services, applications, and serverless functions, no matter how or where they’re developed
✓ Understand what’s happening in your infrastructure, cloud resources, containers, and clusters
✓ Full visibility into the performance of your digital customer experiences
✓ The New Relic experiences you’ve come to know and love —APM, Infrastructure, Logging, Serverless, Browser, Mobile, and Synthetics—all together
Applied Intelligence
Instantly detect, diagnose, and resolve issues before customers notice
✓ Proactively detect and explain anomalies
✓ Reduce alert fatigue and prioritize the issues that matter most
✓ Diagnose and respond to incidents faster

Telemetry Data Platform
Collect, explore, and alert on all your telemetry data from any source in one place. With petabyte scale at pennies per GB, now you can instrument your entire stack, including pre-production environments - no more sampling. Out-of-the-box integrations for open source tools make set up easy, eliminating the cost and complexities of operating additional data stores. Get all of your telemetry data in one place to detect and resolve issues faster than ever before.
Telemetry Data Platform includes:
Data
All of your systems’ telemetry data—metrics, events, logs, and traces—connected in one platform to eliminate silos and scale efficiently.
Log management for any text-based log data or data converted to text originating on-prem or in the cloud with a built-in Logs UI and the full power of the platform.


Log Management
Get the built-in Log Management UI to search, filter, analyze, and save search results for detailed root-cause analysis. Leverage the full power of the Telemetry Data Platform with native alerting, dashboard, or open source capabilities to easily integrate with third-party tools like Grafana.
Analytics
Query any data collected with lightning fast response times using familiar query patterns for your different data types.


Dashboards
With all of your telemetry data in one place, visualize your entire stack's performance together to understand context and resolve issues quickly.
Alerts
Get notified of problems with real-time notifications based on thresholds for every data type you care about--metrics, logs, events, or traces.

Full-Stack Observability
Visualize, analyze, and troubleshoot your entire software stack in one curated, unified platform. And by automatically connecting infrastructure health with application performance and end-user behavior, you can cut through the noise to find the signal. Fast. That means less time troubleshooting, and more time building great software.

Full-Stack Observability includes:
One place to explore your entire system
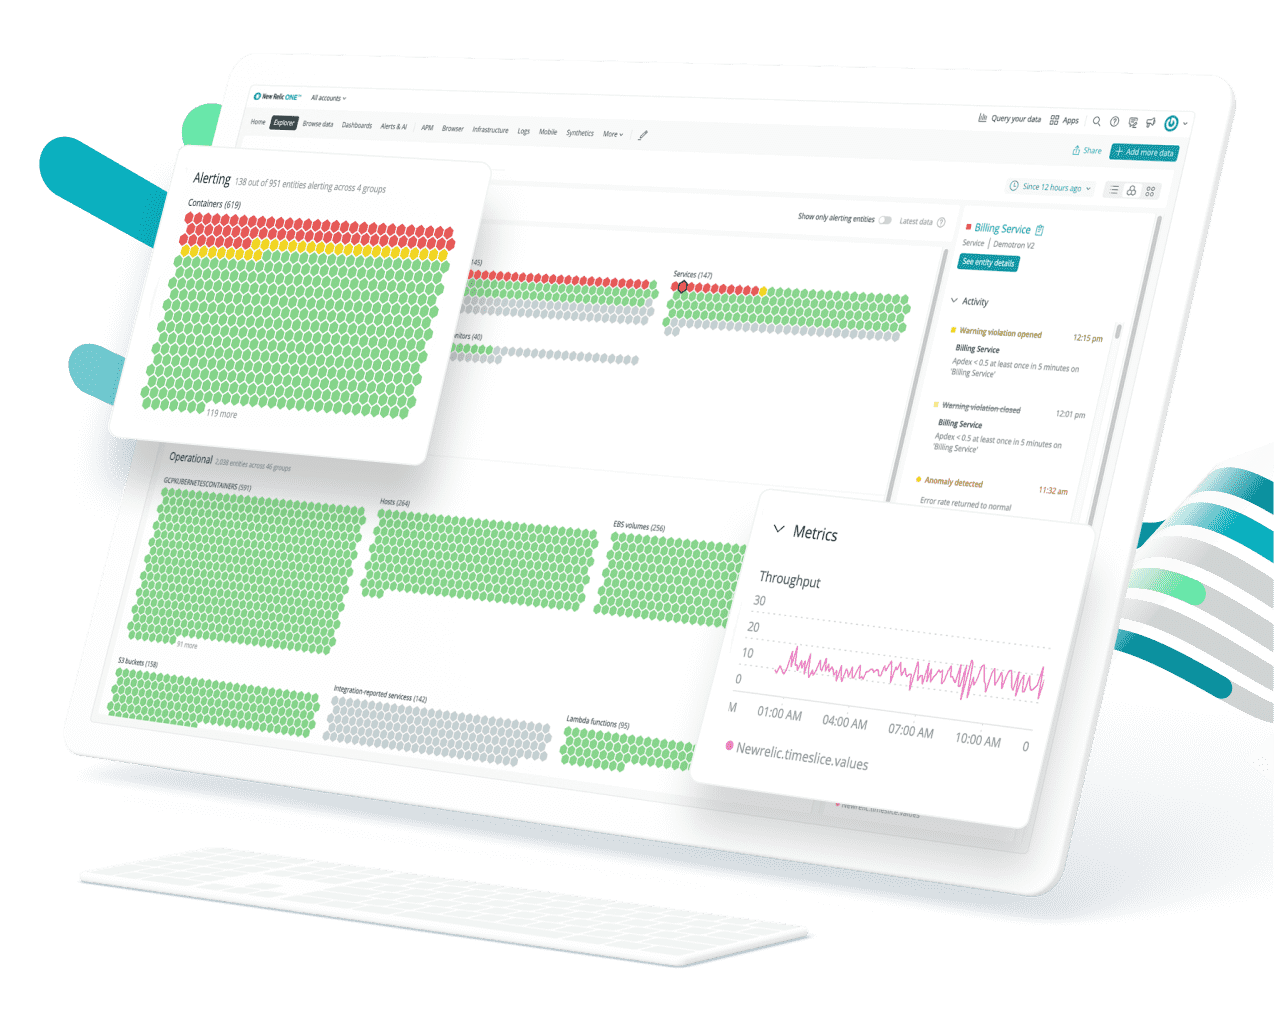
Move faster than ever with New Relic Explorer. Catch sudden changes before they’re problems with New Relic Lookout. And see your estate’s health in a glance with New Relic Navigator. All new, and only with Full-Stack Observability.

APM
Find root causes and fix issues fast. In-depth transaction details show exact method calls with line numbers, including external dependencies for apps of any size and complexity.
Get a complete picture by combining key metrics from mobile and browser apps with supporting services, data stores, and hosts.


Infrastructure Monitoring
Gain visibility into all of your infrastructure—including servers and VMs on-premises, cloud resources and cloud-native infrastructure.
Then connect the health and performance of all of your hosts, services, containers, and resources with the richest application context, logs, and configuration changes, so you can understand, identify, and troubleshoot problems faster.
Serverless Monitoring
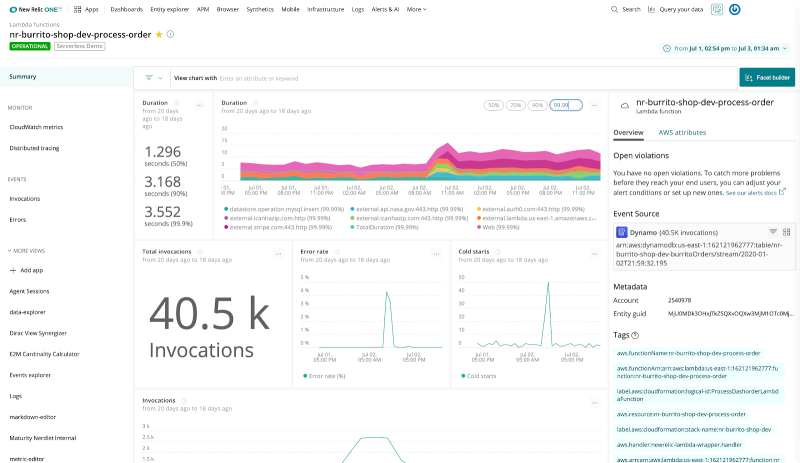
Deliver serverless apps with confidence by rapidly identifying when something goes wrong and quickly pinpointing the problem—without wading through millions of invocation logs.
Auto-instrument monitoring and observability to your serverless functions without requiring code changes. And auto-instrument tracing for your legacy application components alongside the performance of modern serverless components—from backend infrastructure to client-side apps.

Digital Experience Monitoring
Combine RUM, synthetic, and native app monitoring to proactively ensure uptime and performance across services, URLs, APIs, and third party resources on web and mobile.
Benchmark and improve end-user experience for every deployment and code change. End-to-end visibility of latency and errors makes it easy to troubleshoot customer-impacting issues faster, and user-centric perceived performance metrics help you optimize page loads.
Applied Intelligence
Quickly discover and prevent potential problems. Reduce the flood of noisy redundant alerts that make it hard to prioritize issues. Then get to the root cause of every incident with automatic insights. It’s AIOps for everyone, and it’s free.

Applied Intelligence includes:
Instant Anomaly Detection
Spot unusual changes across all applications, services, and log data with automatic alerts based on golden signals like throughput, errors, and latency—with no configuration needed. Even get notifications in Slack and other collaboration tools, along with in-depth analytics to troubleshoot faster, and prevent potential issues before they affect customers.
Correlated Alerts and Events
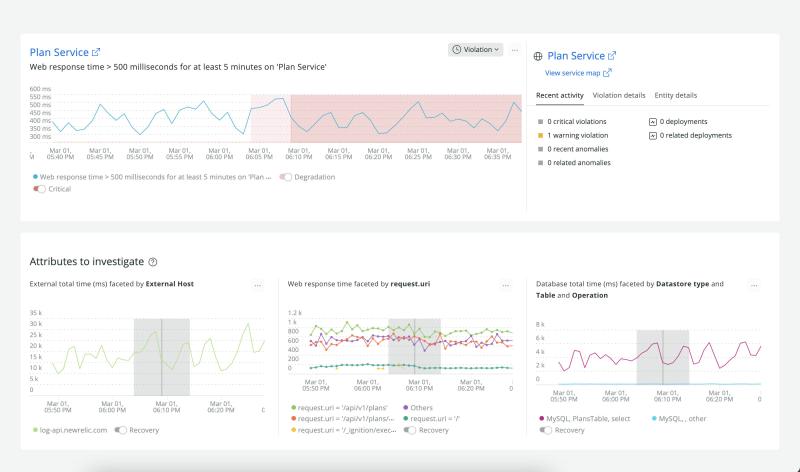
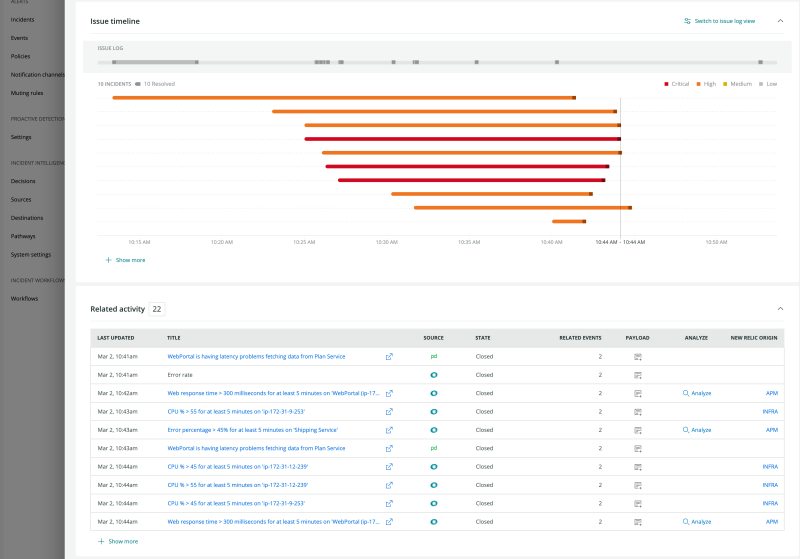
Automatically group alerts and events from any source, and reduce distracting and redundant alerts by up to 80%. Events are instantly correlated based on time, alert context, and relationship data across systems—and you get one issue alert with all the information you need to prioritize and take action.
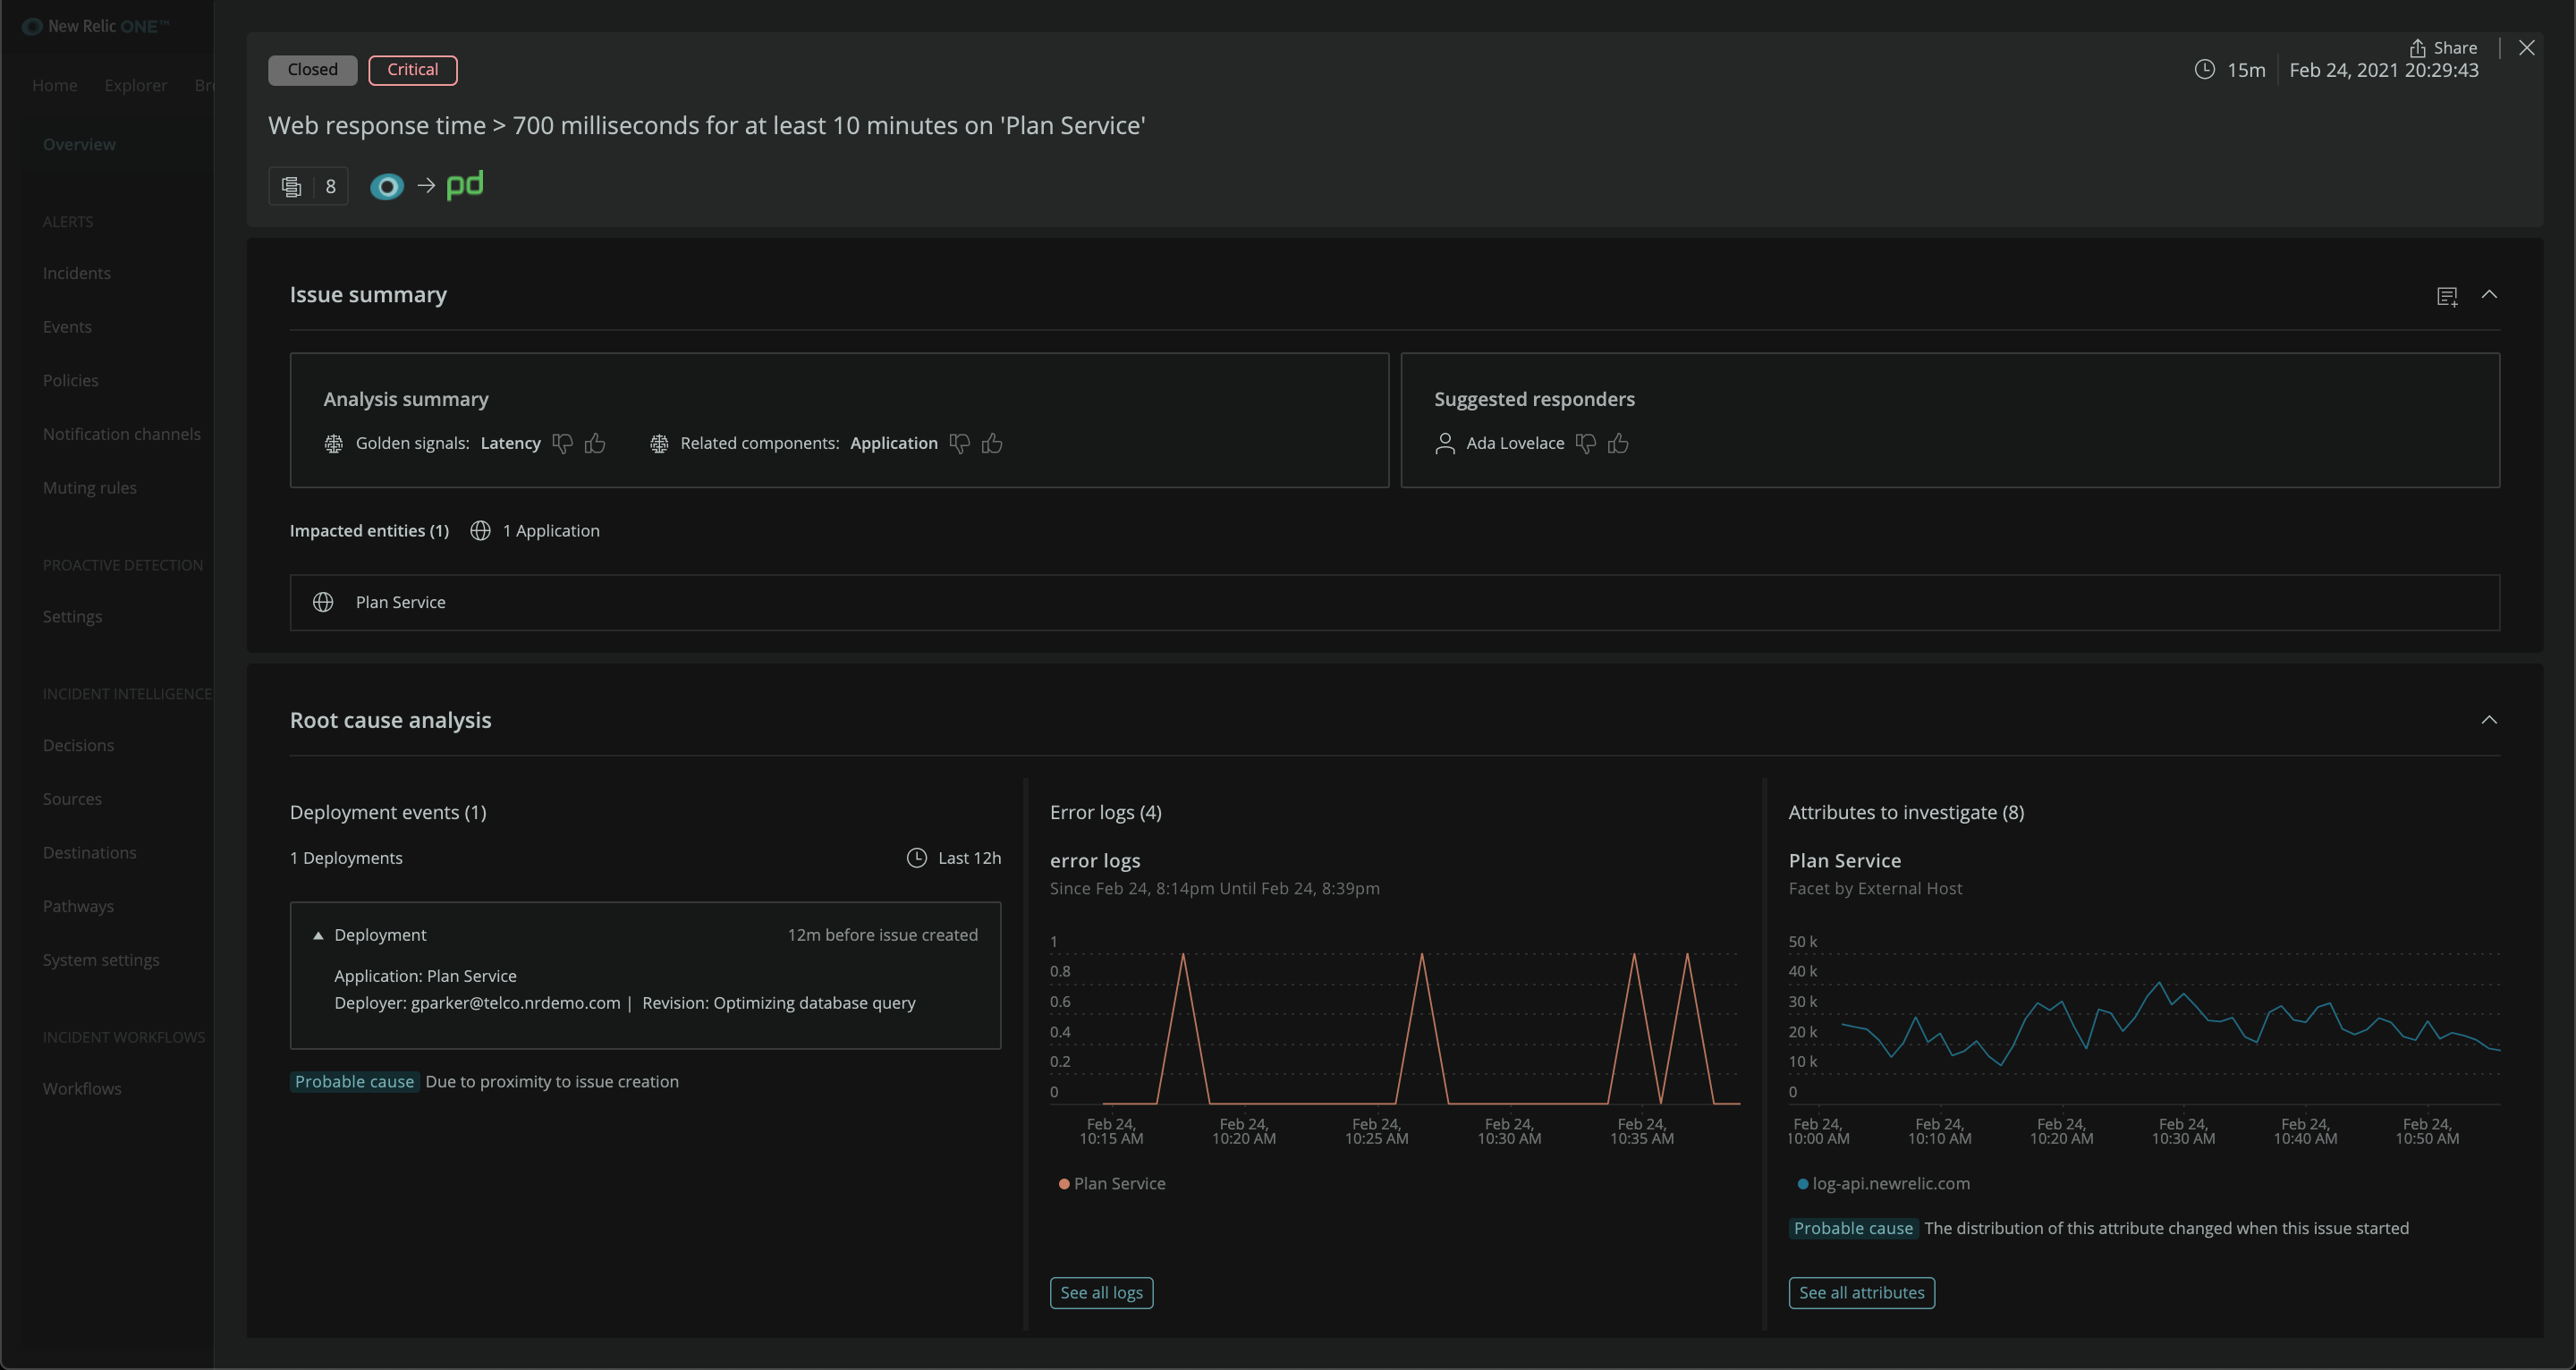
Automatic Root Cause Analysis
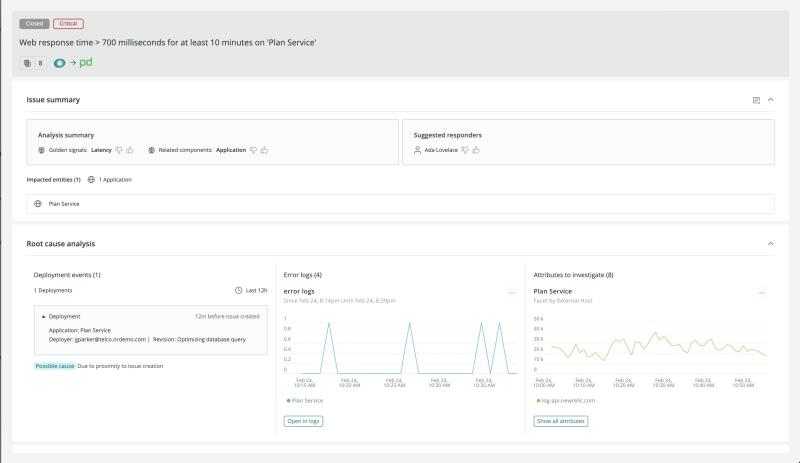
Stop guessing, and solve problems faster with automatic insights into the root cause of every problem. You’ll immediately see why each issue happened, which systems are impacted, and what action you need to take to resolve it. Then get ML-based guidance on who is best equipped to resolve the problem.
Integration with Incident Management
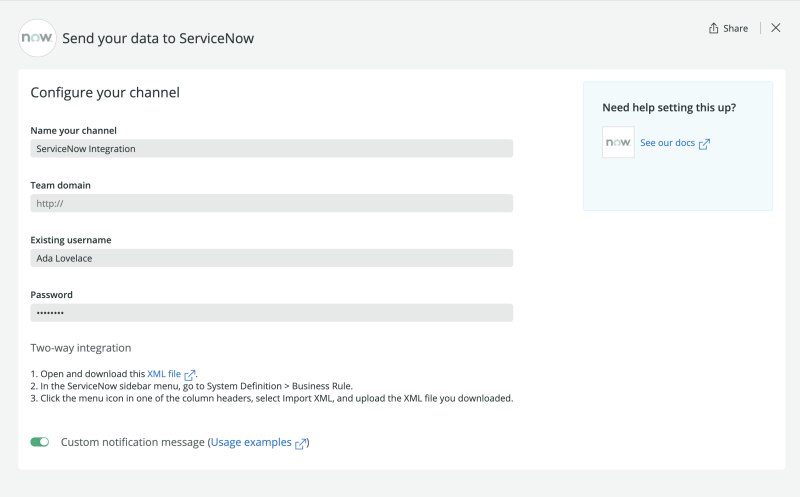
Stop the extra toil of managing incidents across tools by syncing New Relic with your incident management tools. Our two-way integrations with tools like ServiceNow and PagerDuty make it easy to instantly trigger remediation workflows.
Your currency is not supported by this plan.


